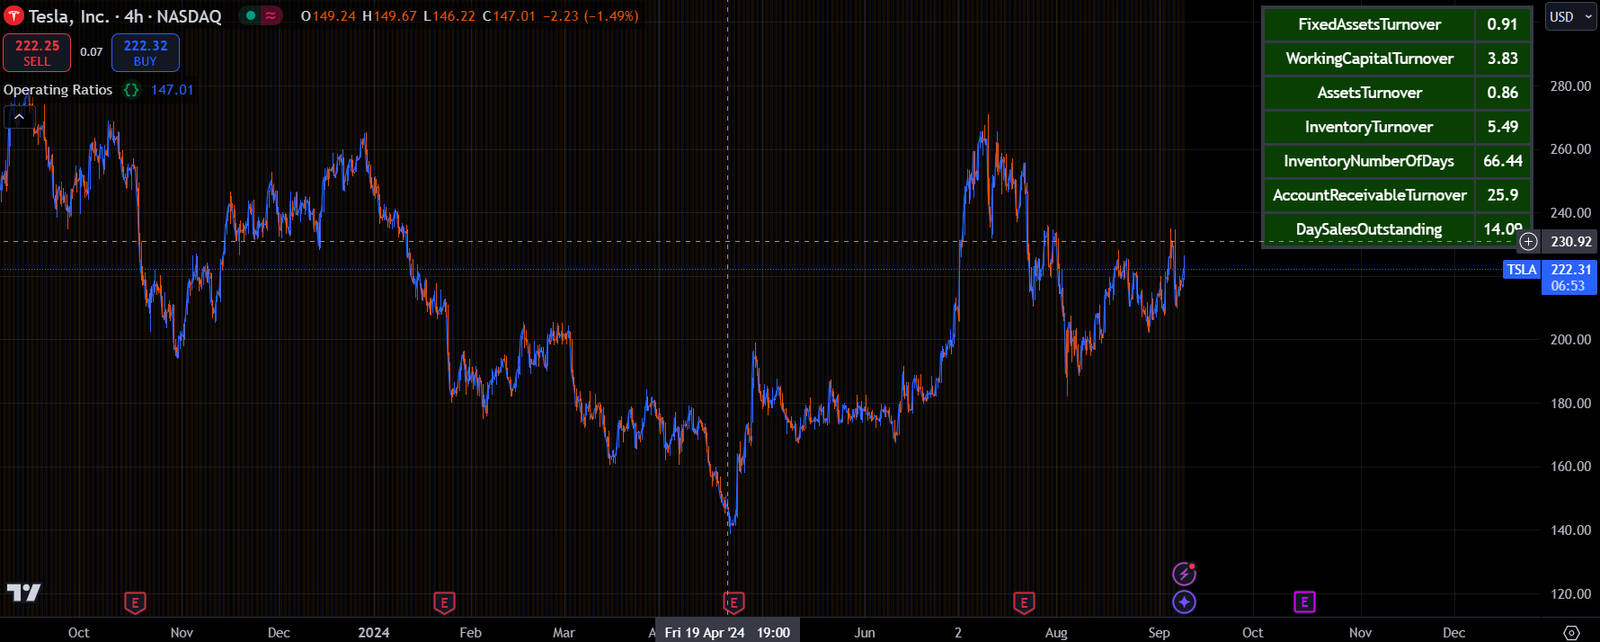
- Fixed Asset Turnover:
This ratio measures how efficiently a company uses its fixed assets (like property, plant, and equipment) to generate sales. It is calculated by dividing net sales by average fixed assets. A higher ratio indicates more efficient use of fixed assets in producing revenue. - Working Capital Turnover:
This ratio shows how efficiently a company is using its working capital (current assets minus current liabilities) to generate sales. It’s calculated by dividing net sales by working capital. A higher turnover suggests that the company is efficiently using its short-term assets and liabilities to drive revenue. - Total Assets Turnover:
This ratio measures how efficiently a company uses all of its assets to generate sales. It is calculated by dividing net sales by total assets. A higher ratio means the company is generating more revenue per unit of asset investment. - Inventory Turnover Ratio:
This ratio indicates how many times a company sells and replaces its inventory over a period. It is calculated by dividing the cost of goods sold (COGS) by the average inventory. A higher turnover means faster movement of inventory, which is generally positive. - Inventory Number of Days:
Also known as Days Inventory Outstanding (DIO), this measures the average number of days it takes for a company to sell its entire inventory. It’s calculated by dividing the number of days in a period (usually 365) by the inventory turnover ratio. A lower number indicates faster inventory turnover. - Accounts Receivable Turnover:
This ratio measures how efficiently a company collects revenue from its credit sales. It’s calculated by dividing net credit sales by average accounts receivable. A higher ratio suggests faster collection of receivables and better cash flow management. - Days Sales Outstanding (DSO):
DSO calculates the average number of days it takes a company to collect payment after a sale. It’s calculated by dividing accounts receivable by total credit sales, multiplied by the number of days in the period. A lower DSO indicates quicker collection of receivables.


Reviews
There are no reviews yet.